Here is an idea I have been working on. It’s very rough, and I would welcome thoughts and feedback. It is a predictive model of squeeze risk. Dive depths are fed into calculations that predict risk of squeeze for each dive. Risk changes over time according to positive adaptations induced by depth training, and negative accumulation of lung micro-injury plus additional injury from symptomatic squeeze incidents.
The model has not been calibrated with any real data. It’s just a concept at this time. The numbers in the example shown are completely made up for illustrative purposes only. The horizontal time scale is days, but this is entirely arbitrary. To move forward it will need real data of dives and squeeze symptoms.
Here are the basic assumptions and how the model works:
- dive to depth D decreases airway pressure Paw, depending on lung properties and muscle activity
- calculated Paw depends on lung compliance, pulmonary vascular compliance, and residual volume
- depth induces a physiological stress on the respiratory system whenever Paw is negative
- there is a safe depth Dsafe up to which no injury takes place, related to tolerable negative pressure
- diving induces positive training adaptation G(t) that strengthens airways and increases Dsafe
- diving also induces contribution to lung micro-injury H(t) if beyond the threshold safe depth Dsafe
- a symptomatic squeeze incident causes H(t) to increase by a jump that depends on symptom severity
- adaptation G(t) decreases toward baseline zero over time due if there is no diving and lack of stimulus
- micro-injury H(t) decreases toward zero over time due to healing during rest periods between dives
- probability of squeeze symptoms is a function of micro-injury H(t) and depth “over-reach” (D - Dsafe)
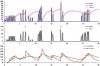
D = dive depth in metres (blue)
Paw = airway pressure in cmH2O if negative, this is the stimulus (black)
Pmus = additional negative airway pressure due to muscle contraction
G = beneficial airway adaptation or fitness (green)
H = cummulative lung micro-injury (red)
Dsafe = safe diving depth resulting in no injury (pink)
Psqz = percent probability of squeeze for that dive (yellow dot)
Depth D is used to calculate static airway pressure Pstatic = Paw + Pmus. This number is a stimulus used to calculate G and H and then Dsafe. When D exceeds Dsafe, this creates an “over-reach” situation and raises probability of squeeze. When there is no dive stimulus, both G (training adaptation) and H (injury) drop slowly toward zero over days to weeks. Yellow circles are probability of squeeze for each dive, and exist only if depth (blue) exceeds safe depth (pink line). Actual squeeze incidents are entered as red dots in second panel, and this adds to total micro-injury (red line in lower panel).
The idea is to capture adaptation, injury, and repair according to magnitude of depth stimulus. It needs data to calibrate.
The model has not been calibrated with any real data. It’s just a concept at this time. The numbers in the example shown are completely made up for illustrative purposes only. The horizontal time scale is days, but this is entirely arbitrary. To move forward it will need real data of dives and squeeze symptoms.
Here are the basic assumptions and how the model works:
- dive to depth D decreases airway pressure Paw, depending on lung properties and muscle activity
- calculated Paw depends on lung compliance, pulmonary vascular compliance, and residual volume
- depth induces a physiological stress on the respiratory system whenever Paw is negative
- there is a safe depth Dsafe up to which no injury takes place, related to tolerable negative pressure
- diving induces positive training adaptation G(t) that strengthens airways and increases Dsafe
- diving also induces contribution to lung micro-injury H(t) if beyond the threshold safe depth Dsafe
- a symptomatic squeeze incident causes H(t) to increase by a jump that depends on symptom severity
- adaptation G(t) decreases toward baseline zero over time due if there is no diving and lack of stimulus
- micro-injury H(t) decreases toward zero over time due to healing during rest periods between dives
- probability of squeeze symptoms is a function of micro-injury H(t) and depth “over-reach” (D - Dsafe)
D = dive depth in metres (blue)
Paw = airway pressure in cmH2O if negative, this is the stimulus (black)
Pmus = additional negative airway pressure due to muscle contraction
G = beneficial airway adaptation or fitness (green)
H = cummulative lung micro-injury (red)
Dsafe = safe diving depth resulting in no injury (pink)
Psqz = percent probability of squeeze for that dive (yellow dot)
Depth D is used to calculate static airway pressure Pstatic = Paw + Pmus. This number is a stimulus used to calculate G and H and then Dsafe. When D exceeds Dsafe, this creates an “over-reach” situation and raises probability of squeeze. When there is no dive stimulus, both G (training adaptation) and H (injury) drop slowly toward zero over days to weeks. Yellow circles are probability of squeeze for each dive, and exist only if depth (blue) exceeds safe depth (pink line). Actual squeeze incidents are entered as red dots in second panel, and this adds to total micro-injury (red line in lower panel).
The idea is to capture adaptation, injury, and repair according to magnitude of depth stimulus. It needs data to calibrate.