• Welcome to the DeeperBlue.com Forums, the largest online community dedicated to Freediving, Scuba Diving and Spearfishing. To gain full access to the DeeperBlue.com Forums you must register for a free account. As a registered member you will be able to:

    • Join over 44,280+ fellow diving enthusiasts from around the world on this forum
    • Participate in and browse from over 516,210+ posts.
    • Communicate privately with other divers from around the world.
    • Post your own photos or view from 7,441+ user submitted images.
    • All this and much more...

    You can gain access to all this absolutely free when you register for an account, so sign up today!

AIDA Results Register

Thread Status: Hello , There was no answer in this thread for more than 60 days.
It can take a long time to get an up-to-date response or contact with relevant users.
I think I found a bug. Was looking at my own graph and I saw the following issue:

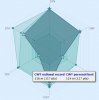
When you look at the average of a country the graph shows +-1 point / meter while the graph shows 0,5 point / meter in the personal best. Of course this must be the last one (so 0,5 points / meter).

Example in my case: (I'm form Belgium, full name: Alenus T)

DNF: avg 41m (41,4 points)
PB 85m (42,5 points)

This gives an incorrect graph because the graph is based on points. Now it looks my DNF is like the avg Belgian freediver, while it's the double...
I think there is something wrong in the calculation of the average result. I'm looking at the graph of Dave Mullins and it shows the graph shows the same avg performances for New-Zealand as for Belgium...
 
Last edited:
OK, I regrouped them a bit. Not only I've put the pool disciplines at the top, and the depth disciplines at the bottom, but also put the lazy disciplines (STA and FIM) together to the left, the fin disciplines to the top and bottom, and the no-fins disciplines to the right - that will allow better visualizing the specialty of each competitor:

pbradar2.gif
 
:head:headIt's not a country average but a global average so that doesn't change of course... But there is still something wrong with the points I think...
 
I think I found a bug. Was looking at my own graph and I saw the following issue:...
I do not see any problem in your profile. As far as I can see everything is all right. The averages in the graph are global, as I wrote, not national. I did not want to clutter the graph with too many hexagons which would make it difficult to read, hence I settled for the global average, which I find more informative than the national one. I will adjust the labels to make it more clear.
 
The points of an avg performance. The avg in DNF is 41m so that's equal to 20,5 points. (0,5 points / meter). But the graph shows me that 41m equals to 41,4 points. Or I am interpreting the graph totally wrong :confused:
 
Yes, you re right, there is a mistake, but the graph is all right. It is the label that is wrong - the avarage points are OK, but the average distances at DYN and DNF should be doubled. I'll fix it.

BTW, I've just added more verbose labels.
 
OK, the DYN and DNF average labels are now fixed. Thanks for bringing it to my attention!
 
The fault is in label presentation of average pool results:
STA 0:54 54.9 pts - must be 4:34
DYN 41m 41.4 - must be 82m
DNF 50m 50.1 - must be 100m
 
Yes, as I told, it was already fixed. And I've finally added the national averages too. A bit more transparent, hence less visible, but it is there now too.
 
In a case of yellow card for max result where is wrong label 0 m with correct points.

Fault: NR, WR (and probably average) shows MAXIMUM results without relations to gender. Women compare to men NR and WR. Vice versa less visible but can be seen in DNF for Russia 160m vs 157m.
 
In case of a yellow card the value is not accessible to the graph (and in some cases it is unknown), hence for the moment it must stay in this way. A more complicated work-around would be needed for fixing it in future.

The results respect the gender you select in the menu - if you want to compare a female competitor to the global (M+F) values, you use "all" as gender. If you want comparing her just in her category, you have to select "women" in the gender select box. I was hesitating doing it automated, but that would then not allow comparing women to global values, which may be often interesting too.

So these are not faults, these are features :)
 
Ivo, can you have the total "spider-web" surface area measured to determine who the greatest over all freediver is?
 
Yes - Will Trubridge. And Natalia, of course, on the women's side.
 
Back to the gender issue pointed out by Osusim - to allow also global comparisons (including both genders), but making it easier for browsing, I changed the behaviour so that when you land on a competitor profile, the gender in the menu is automatically set to the gender of the competitor. It means that by default the results will appear in the context of the respective gender. But still, you can change the gender in the menu to "both" to see the results in the global context.
 
In case of a yellow card the value is not accessible to the graph (and in some cases it is unknown), hence for the moment it must stay in this way. A more complicated work-around would be needed for fixing it in future.
I know that is difficult. Yellow cards creates some mess like in case of David Mullins - 118 m YC (117pts) larger then both his own 114 m WC (114 pts) and 116m NR of NZ (116 pts)
 

Attachments

  • mullins.jpg
    mullins.jpg
    47.1 KB · Views: 165
Yes, yellow cards simply won't work well for now. Can't do much without seriously reworking the system. And even so, the main problem with yellow cards is that sometimes I get from the organizers the performance value, but no points value (just a note there was a penalty), in other cases I get the final points, but no proper value of the performance, etc. Besides others, penalized performances are excluded also from WR status (and in most countries from the NR status as well). Hence, the penalized performances are simply not handled here perfectly (though not really wrong either), and I am not sure whether I'll be able to optimize it better. In some case it may be possible, in others not.

In case of Dave, it simply shows 117 points that he got for the 118m CWT dive (which is correct, and since it was penalized it was not a NR). Just instead of the 118m, it shows then on the label the closest non-penalized RP value, which is 114m. That's a bit confusing, but currently I cannot do anything about it without rebuilding the whole underlying system. Anyway, the graph is correct, it is just the RP value on the label that is wrong. Maybe in future I'll fix it, but it is a lot of work, so it will certainly not be soon. Or in case I find sponsors willing to pay for the time I am spending on it :)
 
Last edited:
I should also change the labels "world record" and "national record", since they are in fact world's or nation's best performances, and not necessarily records (for example Dave's world's best DNF is actually no WR, but just NR). That's easy to do, just the label will be again longer and taking more space on the limited space - that was the primary reason I selected the simplified WR / NR labels, but I see it may be confusing sometimes, so I better change it now.

EDIT: ok, labels changed now
 
Last edited:
Raver Dave will dive with his new PB :)

I think average value should come from best result per athlete and not all of results.
For example there are 3 athletes in a country with only 3 results of 30m, 60m and 90m, national average is 60m. But if the 3d athlete also has 80m, 84m, 86m in a past then your diagram shows average as about 71m.
 
DeeperBlue.com - The Worlds Largest Community Dedicated To Freediving, Scuba Diving and Spearfishing

ABOUT US

ISSN 1469-865X | Copyright © 1996 - 2024 deeperblue.net limited.

DeeperBlue.com is the World's Largest Community dedicated to Freediving, Scuba Diving, Ocean Advocacy and Diving Travel.

We've been dedicated to bringing you the freshest news, features and discussions from around the underwater world since 1996.

ADVERT